Affichage de plusieurs tracés dans la même figure#
Style « pyplot » - Utilisation de subplot()#
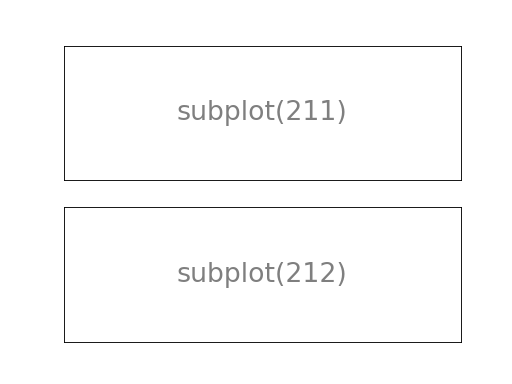
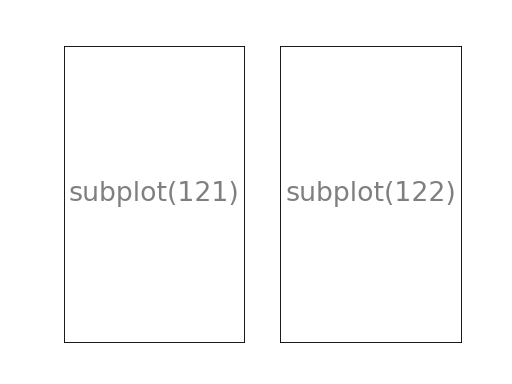
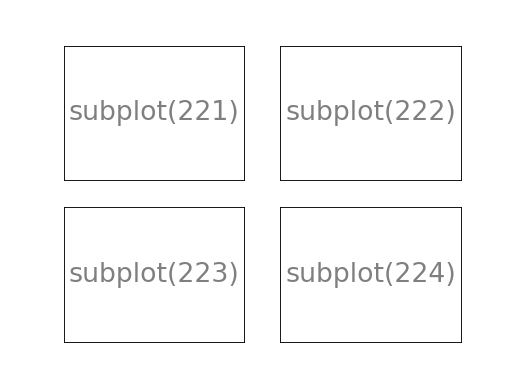
La fonction subplot() permet d’organiser différents tracés à l’intérieur d’une grille d’affichage. Il faut spécifier le nombre de lignes, le nombre de colonnes ainsi que le numéro du tracé.
Exemple
import numpy as np
import matplotlib.pyplot as plt
def f(t):
return np.exp(-t) * np.cos(2*np.pi*t)
t1 = np.arange(0.0, 5.0, 0.1)
t2 = np.arange(0.0, 5.0, 0.02)
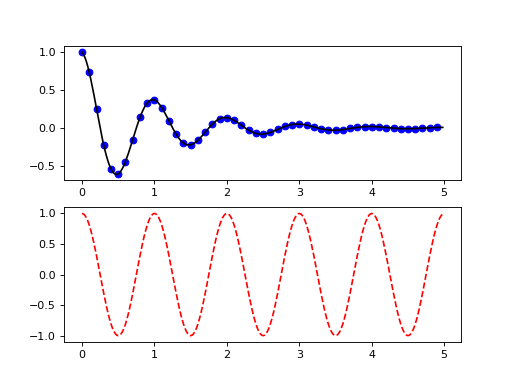
plt.subplot(211)
plt.plot(t1, f(t1), "bo")
plt.plot(t2, f(t2), "k")
plt.subplot(212)
plt.plot(t2, np.cos(2*np.pi*t2), "r--")
plt.show()

Exemple de disposition en colonne
Exemple de disposition en ligne
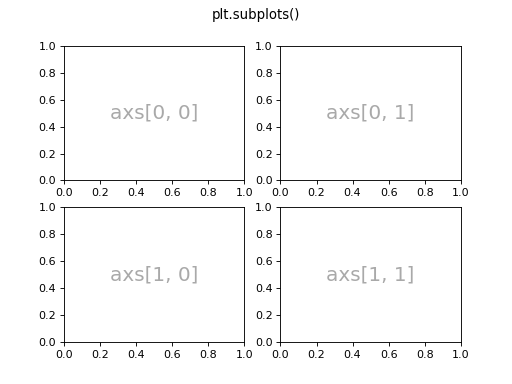
Exemple de disposition en grille
Style « Orienté Objet » - Utilisation de subplots()#
Exemple de disposition en colonne
import numpy as np
import matplotlib.pyplot as plt
def f(t):
return np.exp(-t) * np.cos(2*np.pi*t)
t1 = np.arange(0.0, 5.0, 0.1)
t2 = np.arange(0.0, 5.0, 0.02)
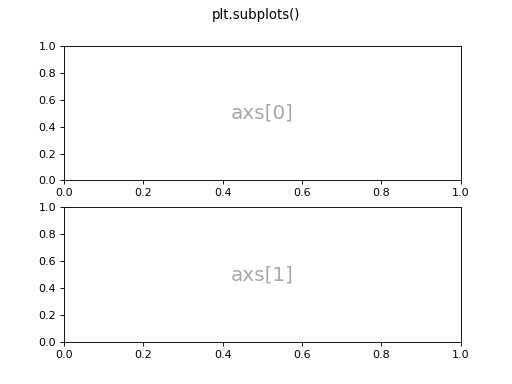
fig, axs = plt.subplots(2, 1)
axs[0].plot(t1, f(t1), "bo")
axs[0].plot(t2, f(t2), "k")
axs[1].plot(t2, np.cos(2*np.pi*t2), "r--")
plt.show()
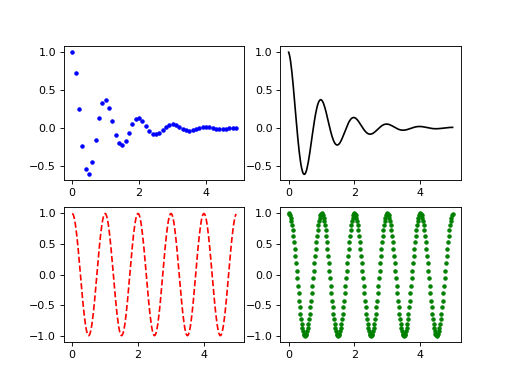
Exemple de disposition en grille
import numpy as np
import matplotlib.pyplot as plt

def f(t):
    return np.exp(-t) * np.cos(2*np.pi*t)

t1 = np.arange(0.0, 5.0, 0.1)
t2 = np.arange(0.0, 5.0, 0.02)

fig, axs = plt.subplots(2, 2)

axs[0, 0].plot(t1, f(t1), "b.")
axs[0, 1].plot(t2, f(t2), "k")
axs[1, 0].plot(t2, np.cos(2*np.pi*t2), "r--")
axs[1, 1].plot(t2, np.cos(2*np.pi*t2), "g.")

plt.show()